
The WEX Index®
Fleet Fuel Spend, Fraud Risk and EV Readiness, Benchmarked
The average U.S. fuel price rose approximately 43% year over year in Q3, and the number of phishing emails has climbed more than twelvefold since AI tools became widely available. Fleets kept fueling through 2026 anyway.
Transaction data from WEX’s 600,000+ mobility customers, along with modeled EV analysis from Sawatch Labs (a WEX company), shows what fleets paid, how they fueled, and where risk can show up.
The WEX Index® gives you benchmarks to see where your fleet stands, and where you may be leaving money on the table.
Quick takeaways
What is the WEX Index?
The WEX Index® isn’t built from a survey designed around a predetermined hypothesis. It is a fleet and mobility benchmark built from transaction data from WEX’s 600,000+ mobility customers across its North American local fleet, Over-the-Road (OTR), and International business units, along with modeled EV analysis from Sawatch Labs (a WEX company).
While fleets can’t control fuel prices or how fraud tactics evolve, they can find out whether their own spending, fueling patterns, and risk exposure look normal. The Index gives them a factual baseline to check performance against.
Why didn’t fleets cut fuel use when prices jumped?
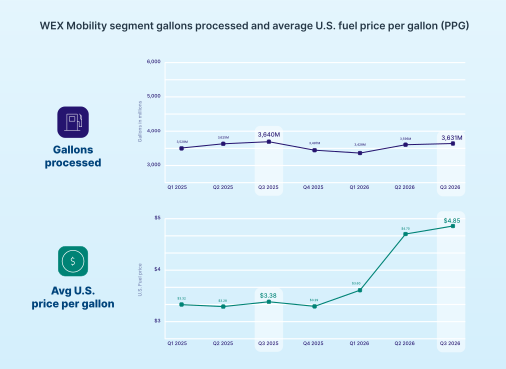
The work doesn’t stop when prices rise. In Q3, the average U.S. fuel price climbed approximately 43% year over year—from $3.38 per gallon in Q3 2025 to $4.85 in Q3 2026. Interestingly, over that stretch, gallons pumped across WEX’s Mobility segment stayed essentially flat.
The cost was and is real. One utility company that uses WEX said its fuel costs rose by roughly $5 million in the first six months of 2026. Fleets across the board absorbed increases because routes still had to run. WEX customers kept working as fuel became more expensive. With limited room to cut volume, how fleets buy (where drivers fuel and what grade they choose) is where the opportunity lies.
Where and what fleets buy matters more than how much
Nearly 40% of North American local fleets paid more per gallon than the benchmark. Since fleets couldn’t cut how much fuel they bought, the difference in the price per gallon became really apparent. Our data indicates that while there are many different drivers there are three main areas that impact cost – location, industry and fuel grade.
Location
The WEX Fuel Price Index (FPI) measures the local market pump price wherever our customers are fueling, primarily within one to five miles of the station. That makes it more precise than a district or state average since prices can differ from one part of a state to another.
Across North American local fleets (excluding OTR):
- 38.1% of fleets paid above the local FPI
- 36.1% were on benchmark (within ±$0.02)
- 25.8% paid below it
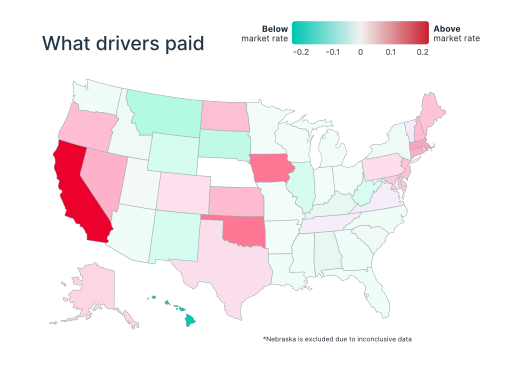
The gap varies by state. Fleets in Washington, D.C. paid the most above the benchmark. Hawaii is the exception: fleets there paid $0.06 per gallon below the local $5.232 market rate, paying $5.171 per gallon across approximately 420,000 transactions. Fleets in California, Iowa, and Oklahoma are paying four to six cents above the local FPI on average.
Paying above benchmark is not always a matter of choice. Drivers are often on tight schedules or unfamiliar routes and fuel at the nearest station, and that can sometimes be the right call. A 10-minute detour to save four cents a gallon can cost more in time and mileage than it recovers. The opportunity lies in fueling decisions that focus on convenience instead of strategy. Before asking a driver to detour, consider whether the price gap is substantial, the detour is short, and the trip still makes sense as a business decision.
By industry
Fuel discipline varies by industry. Manufacturing and retail trade had the highest shares of fleets paying above the FPI, and both tend to have more variable routes or less centralized fueling decisions. “Other services,” which includes Repair and maintenance, Religious and civic organizations, Dry cleaning, and Auto repair, had the most fleets paying below it.
| Industry | Above FPI | At FPI | Below FPI |
|---|---|---|---|
| Manufacturing | 42.3% | 33.5% | 24.2% |
| Retail trade | 39.4% | 33.5% | 27.1% |
| Construction | 38.0% | 38.8% | 23.3% |
| Other services | 38.0% | 33.9% | 28.1% |
| Administrative & waste services | 36.2% | 37.4% | 26.4% |
Fuel grade
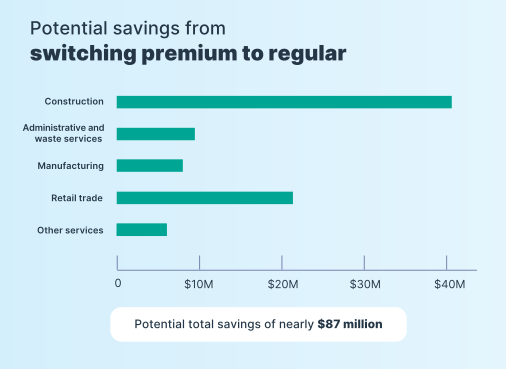
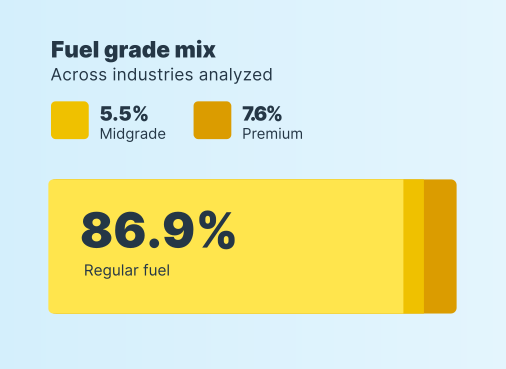
Premium fuel makes up 7.6% of gasoline fills across the top five industries, at an average gap of 78 cents per gallon over regular. Through Q3 2026, that adds up to nearly $87 million in potential savings.
“If a driver is fueling super unleaded for a half-ton cargo van, that driver could save on fuel costs without sacrificing efficiency by fueling regular unleaded instead. We want our clients to have these insights and be able to address them.”
Billy Dobosz, Assistant Vice President of Business Development for Enterprise Fleet Management
See the full state-by-state, industry and fuel-grade breakdown in the WEX Index report
Is overnight fueling normal, or worth a closer look?
Most fleets run on a predictable clock, and knowing that baseline makes a real deviation easier to spot. Across WEX’s North American local fleet customers:
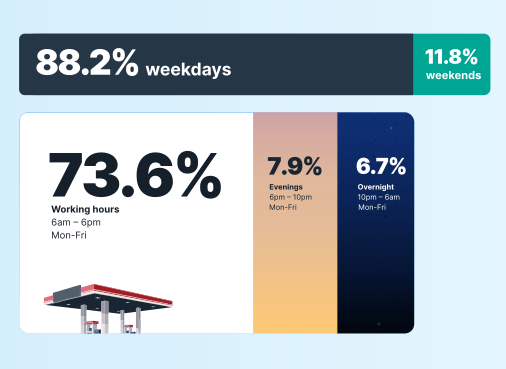
- 88.2% of fueling transactions happen on weekdays
- 73.6% happen during work hours (Mon–Fri, 6 a.m.–6 p.m.)
- 7.9% happen on weekday evenings (6–10 p.m.) and 6.7% overnight (10 p.m.–6 a.m.)
“Normal” differs by industry. Construction has the highest overnight share (about 9.4%) and Retail trade the lowest of the five industries analyzed. Fuel consumption varies too: in 2026, retail trade vehicles averaged 141 gallons a month, compared with 98 in Construction, 91 in Manufacturing, 87 in Administrative and waste services and 86 in Other services. With that in mind it is important to compare your fleet with your industry peers, not the overall average.
Fraud is getting harder to catch
The number of phishing emails has climbed 1,265% since Q4 2022, when AI tools became widely available, and the threat is growing harder to control as AI use spreads. Higher prices raise the stakes: at $5 a gallon instead of $3, every fraudulent fill-up costs 67% more. And as legitimate fill-ups get more expensive, an unusually large transaction may stand out less by dollar amount alone.
Three signals worth tracking through consistent driver behavior monitoring:
None of these signals confirms fraud on its own; each is a reason to review the transaction and confirm it was legitimate. A driver might be working outside an assigned route, or a vehicle might carry heavy equipment or run dense delivery schedules. But when a driver or vehicle sits far from its peers, a closer look makes sense. Level III transaction data (e.g., fuel grade, cost per gallon, product type, sales tax), which comes with some fleet cards, can show you when, where, and what drivers bought.
“The Level III reporting that we get from our fuel card helps us understand where those fuel dollars go. And then the constant fraud monitoring that our fuel card provider does on behalf of our clients is really critical as well.”
Steve Jastrow, SVP, Strategic Advisory and Client Analytics, Element Fleet Management
Learn how to benchmark your own fraud signals against industry norms in the WEX Index report
Should your fleet go electric?
The better question isn’t whether to electrify, it’s which vehicles in your fleet to convert. Vehicle-level telematics data, not fleet-wide averages, tells you which vehicles should stay internal combustion engine (ICE) and which should convert.
Fleet electrification is progressing at different speeds. For some vehicles and operating patterns, EVs can offer attractive total costs of ownership, supporting a gradual transition to mixed-energy fleets. EV range has improved. EVs typically cost less to maintain than ICE vehicles, and fleets have better data to determine which vehicles are ready to convert.
“As we’ve seen a larger focus on total cost of ownership (TCO) optimization over the last decade, the variability of fuel costs impacting fleets, and more powerful batteries providing greater range, it’s become clear that when matching the vehicle to the need, there are areas where EVs perform very well.”
Dylan Jones, SVP and General Manager of Mobility Growth, WEX
Sawatch Labs, the WEX fleet electrification intelligence business, modeled telematics data from 8,798 vehicles from U.S. and European fleets:
“Moving towards electric vehicles was a financial decision. We run a lot of heavy equipment and our fuel spend can be $60,000 a month. Anything that we can do to control that spend is critical to our bottom line.”
BJ Azzarelli, President, Dallas 1 (WEX customer)
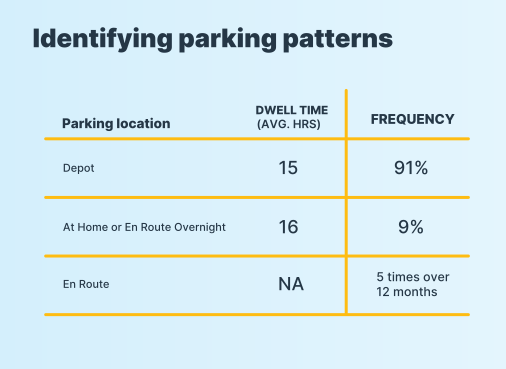
When considering an EV transition, fleet managers should ask two key questions: can this vehicle handle the routes on an overnight charge, and is there a reliable place to charge it? When both answers are yes, the case for converting gets stronger. In the study’s modeled example, a vehicle returned to its depot 91% of the time and spent about 15 hours there, plenty of time for a full overnight charge.
Where you charge matters. Level 2 public charging has run 25–32 cents per kWh through 2026, while Level 3 (DC fast) charging has run 52–57 cents, nearly double. For drivers that rely on en-route charging, fleet managers need to understand the increased costs of doing so.
“This first index is a snapshot of a turbulent year, but what we’re really doing here is preparing our customers for the future. Every fleet that uses this report as a starting point is in a stronger position to face what comes next.”
Carlos Carriedo, COO, Americas Payments and Mobility, WEX
Five ways to act on the data
- Set a baseline for your fleet. Give every driver a unique ID and pair each vehicle with a card so your data is clean.
- Compare transactions against the local benchmark. Fuel is typically 20–30% of fleet operating costs. Use the FPI as a starting point, and weigh any detour against the miles it adds.
- Focus on the numbers that matter. Combine card controls, real-time alerts and telematics to flag unusual spend and unauthorized purchases early.
- Match the vehicle to the need. Use vehicle-level data to decide where EVs fit and where ICE vehicles are still the best choice.
- Revisit your baseline as prices change. Reset benchmarks and fraud alerts as conditions shift.